07
Jan

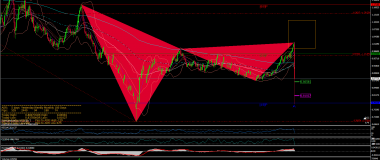
Deutsche bank analysis: 2018-12-27 – historical minimum DBK – 6,63 eur, DB – 7,62 USD A cypher harmonic pattern – monthly chart- very strong buying signal December 2018/January 2019 – also weekly chart – buying signal Revenue and earnings: Deutsche Bank will be probably profitable after 3 years of loss – buying signal
01
Feb

The oil and its price have been widely discussed for months. Watching the oil price falling lower and lower and its impact on the markets, people are wondering where might be the price bottom. Let´s analyze the circumstances. Crude oil – weekly storage report: increase of stocks 356 635 thousand barrels – September 26, 2014 […]
01
Jun

Net position of managed money: increase of positions 47232 – February 17, 2015 95957 – May 26, 2015 Cattle on feed – weekly report: Cattle and calves on feed for slaughter market in the U. S. for feedlots with capacity of 1,000 or more head totaled 10.6 million head on May 1, 2015. The inventory […]
16
Jan

technical analysis: – more interesting is USD/CHF chart (despite the fact that everyone is talking about EUR/CHF) – announcement of Swiss National bank concernig end of cap… from 1,02389 USD/CHF ( selling opportunity): a/ bearish harmonics weekly zone (gartley bearish) -see featured image – USD/CHF weekly chart. b/ murrey match last line +2/8 is 1,02539 […]
25
Dec

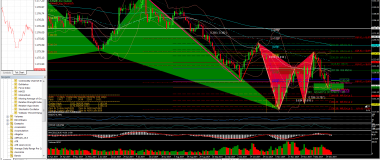
Gold daily patterns confirmed – harmonics, fibonacci, murrey lines technical analysis: – confirmed daily support harmonics (butterfly bullish) 1131,43 usd, also murrey line 1/8 1140,63– possible 3,91 usd – then nice pullback to 50% fibonacci retracement with harmonics (gartley bearish) and murrey match line 7/8, resistance 1238,30 usd – now small support 1171-1173 usd ( […]
13
Dec

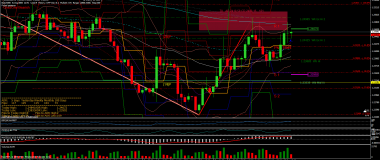
Resistance: red area – harmonics rules, HAR 1,2487 ema 200 – 1,248 target – possible break of ema 200 (blue line) line or if no then fall down